Ultimate Guide to Social Media Video Metrics

Ultimate Guide to Social Media Video Metrics
Most video metrics do not tell me what to do next. The numbers that matter are the ones that help me fix the next post: retention shows where people leave, CTR shows if packaging works, shares and saves show topic fit, and conversions show if the video made money or drove action.
Here’s the short version:
- I do not compare raw views across platforms. A view on TikTok, YouTube, Instagram, Facebook, LinkedIn, and X is measured in different ways.
- I use retention as the main problem-finder. If viewers drop in the first 3 to 10 seconds, the hook is weak or the intro is too slow.
- I check shares and saves over likes. Likes are light feedback. Shares and saves often show stronger interest.
- I connect engagement to business results. High comments with low clicks usually means the CTA is weak.
- I track four groups of metrics: reach, attention, engagement, and conversion.
- I review trends by theme, schedule, and platform pattern. I look for what keeps watch time, repeat viewers, clicks, and sales moving.
A few formulas make the data easier to read:
- Average view duration = watch time ÷ plays
- Retention rate = average view duration ÷ video length × 100
- CTR = clicks ÷ impressions × 100
- Conversion rate = conversions ÷ views × 100
- ROI = (revenue − cost) ÷ cost × 100
Quick comparison:
| Metric | What I learn from it | Common fix when it’s low |
|---|---|---|
| Views / Reach | Whether people saw the post | Change hook, thumbnail, title, or posting time |
| Watch Time / Retention | Whether people stayed | Tighten intro, cut slow parts, improve pacing |
| Shares / Saves / Comments | Whether people cared enough to react | Post more useful, opinion-led, or teachable topics |
| CTR / Conversions | Whether the post drove action | Make the CTA clearer and match the promise better |
The main idea is simple: I use metrics to make editing, scripting, packaging, and CTA choices. That turns dashboards into better videos instead of just more numbers.
Understanding Social Media Video Metrics: How Views Count Across Platforms
sbb-itb-4a26d6a
Core Video Metrics and How to Read Them
Use each metric to answer a specific question. Don't treat any single number like a final score. The metrics below show what happened, but the meaning changes by platform and by context. First, get clear on what each one measures.
Exposure and Attention Metrics: Views, Impressions, Reach, Watch Time, and Retention
Impressions count how many times your video showed up on someone's screen. Reach counts how many different people saw it. So if impressions are high but reach is low, you're showing the video to the same group again and again. That can slow audience growth.
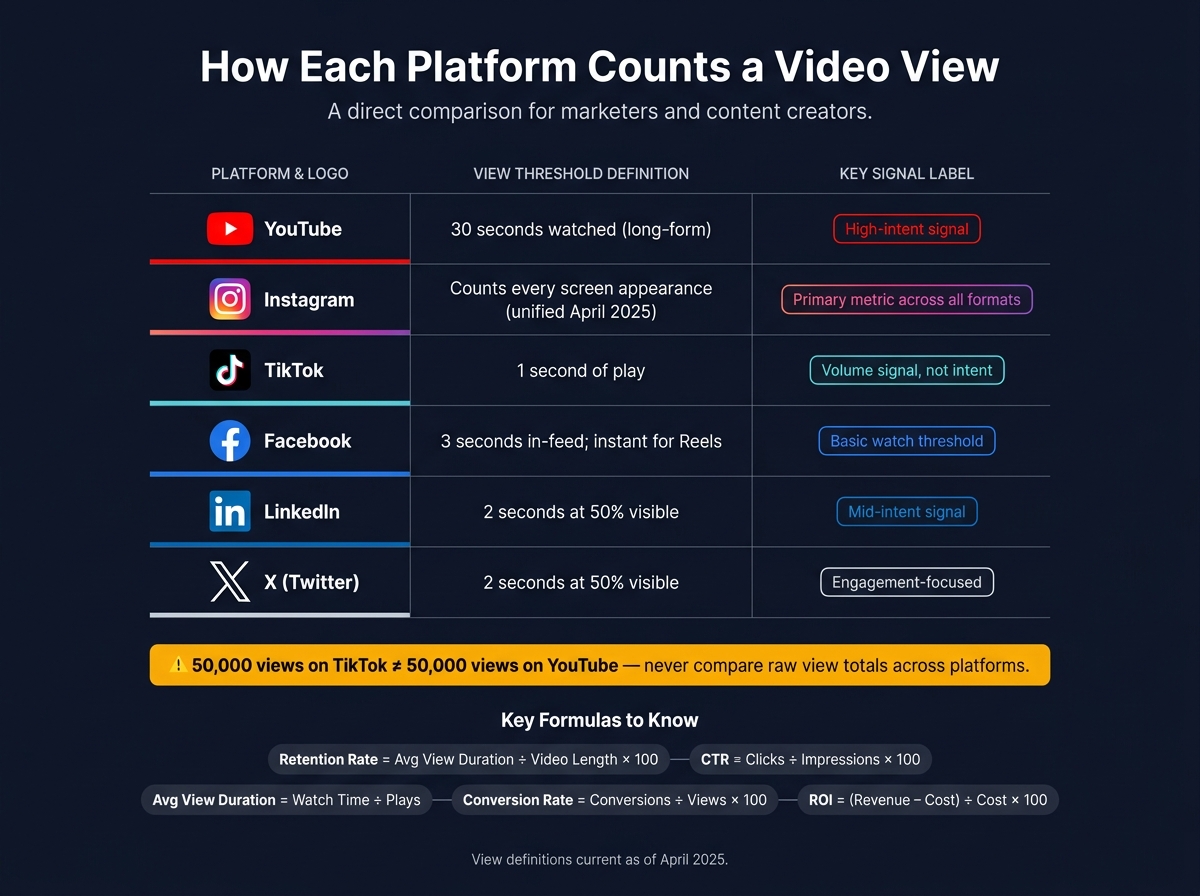
Views are not measured the same way across platforms. TikTok counts a view after 1 second. Facebook and standard Instagram in-feed videos count a view after 3 seconds. YouTube uses a 30-second threshold for long-form video. LinkedIn and X both use a 2-second, 50%-visible threshold. Instagram is the tricky one because it depends on format, and as of April 2025, views became the primary metric across content formats.
That means 50,000 views on TikTok and 50,000 views on YouTube do not mean the same thing.
| Platform | What Counts as a View | Key Signal |
|---|---|---|
| TikTok | 1 second | Volume, not intent |
| Format-dependent | Primary metric across content formats | |
| 3 seconds | Basic watch threshold | |
| YouTube | 30 seconds (long-form) | Higher-intent signal |
| LinkedIn / X | 2 seconds, 50% on screen | Uses a 2-second, 50%-visible threshold |
Watch time is the total amount of time people spent watching your video. Average view duration is watch time ÷ total plays, which tells you how long the average person stayed. Retention rate is avg. view duration ÷ video length × 100, which shows how much of the video people watched before leaving.
This is where things get useful. If your graph falls hard at 12 seconds, viewers are losing interest there. Maybe the intro drags. Maybe the payoff comes too late. Maybe the hook just isn't doing its job.
Treat retention as your main diagnostic metric. It tells you, in plain terms, whether your script, pacing, and opening are working.
"If you post a one-minute video and the average watch time is three seconds, it's an indicator that the start of your video is missing a hook." - Eileen Kwok, Former Social Media Strategist, Hootsuite
Once you understand attention, compare it with engagement.
Engagement and Intent Metrics: Likes, Comments, Shares, Saves, Clicks, and CTR
Not all engagement means the same thing.
Likes show positive reaction, but they don't tell you much by themselves. Someone can like a video in a split second and move on. Nice to have? Sure. Deep signal? Not usually.
Comments matter more. They show that people felt something strong enough to respond. That could be interest, confusion, agreement, or pushback. Either way, comments often help because they create conversation.
Shares and saves tend to mean more than likes. A share is a public vote of confidence. When someone reposts your video, they're attaching their own name to it. A save means the content was useful enough to come back to later. That's a much stronger sign of intent.
Clicks and CTR (click-through rate) connect attention to action. CTR is clicks ÷ impressions × 100. If CTR is high, your video pushed people to take the next step. If retention is strong but CTR is weak, the issue usually isn't the content itself. It's the packaging - most often the title or thumbnail.
When engagement goes up, don't stop there. Check whether it also leads to clicks, conversions, or follower growth.
Business and Growth Metrics: Conversions, ROI, Followers, and Returning Viewers
Once exposure and engagement look healthy, business metrics tell you whether the video drove results that matter.
Conversions tie video performance to action: sign-ups, purchases, downloads, or whatever goal you set. Conversion rate = conversions ÷ total views × 100. ROI = (Revenue − Cost) ÷ Cost × 100.
Then you have audience growth signals. Follower growth shows whether your content is bringing new people into your orbit. Returning viewers show whether people want to come back. One tells you you're reaching new people. The other tells you you're worth revisiting.
| Metric | What It Measures | How to Interpret It |
|---|---|---|
| Conversion Rate | % of viewers who took a target action | Low rate means the CTA or offer is weak |
| ROI | Revenue vs. production/distribution cost | Higher ROI means stronger payoff relative to spend |
| Follower Growth | Audience growth over time | Growth shows content is expanding your audience |
| Returning Viewers | % of audience that comes back | High rate = stronger loyalty and repeat interest |
| Watch Time (Total) | Cumulative time watched across all plays | Primary algorithmic signal on YouTube and LinkedIn |
| Avg. View Duration | Total watch time ÷ total plays | Reveals hook strength and pacing issues |
| Retention Rate | Avg. view duration ÷ video length × 100 | Pinpoints where viewers drop off |
| CTR | Clicks ÷ impressions × 100 | Low CTR = packaging issue (title or thumbnail) |
Next, find these metrics inside Instagram, TikTok, YouTube, Facebook, X, and LinkedIn analytics.
Where to Find Video Metrics on Major Platforms
Social Media Video Metrics: Platform View Definitions & Key Signals
Now it’s time to put the metric framework to work. The trick is simple: find each number inside the platform where you publish. Every app puts analytics in a different spot, and raw totals don’t line up cleanly from one platform to another. So use this section to locate metrics, not stack one app against another.
You do not need to memorize every menu path. You just need to pull the same core metrics from each platform so you can spot patterns over time.
Instagram, TikTok, and YouTube Analytics
On Instagram, tap "View Insights" right below any video post or Reel. You’ll need a professional or creator account for access. From there, track plays, reach, saves, shares, and watch time. As of April 2025, Instagram made "Views" its main metric across all content types. That means it counts every time a video appears on screen, even if it doesn’t start playing.
For TikTok, go to Profile > Menu (three lines) > Creator tools > Analytics. Open the "Content" tab to check video-level results and average watch time. TikTok now treats 15–20 seconds of watch time as a stronger performance signal. That’s why completion rate and average watch time deserve most of your attention.
With YouTube, all analytics live in YouTube Studio. Use the "Content" tab for video-level results and average watch time. The "Audience" tab shows returning viewers vs. new viewers, which helps you tell whether a video is pulling people back or just reaching first-timers.
Facebook, X, and LinkedIn Analytics
For Facebook, look inside Meta Business Suite > Insights > Content. Pay close attention to 1-minute views and ThruPlays. ThruPlays track videos watched to 15 seconds or to completion, and both metrics tell you much more than a basic view total when you want to judge actual interest.
On X (formerly Twitter), analytics are tied to each post. The main numbers to check are views, engagements, and retweets.
For LinkedIn, use Page Analytics. One thing to watch for: average and total watch time only show up for videos posted after January 6, 2026. If you’re looking at older posts, those fields will stay empty.
Cross-Platform Analytics Comparison Table
This table works best as a quick reference for where to click and how to read each metric. It is not for comparing raw totals across platforms, because each platform defines a “view” in its own way.
| Platform | Where to Find Analytics | View Count Definition | Key Organic Metrics |
|---|---|---|---|
| YouTube | YouTube Studio > Analytics | ~30 seconds | Watch time, retention curves, CTR, returning viewers |
| Tap "View Insights" on post | Counts screen appearances (unified April 2025) | Plays, reach, saves, shares, watch time | |
| TikTok | Creator tools > Analytics | Instant play (1 second) | Completion rate, avg. watch time, shares |
| Meta Business Suite > Insights | 3 seconds in-feed; instant for Reels | 1-minute views, ThruPlays, reactions | |
| Page Analytics | 2 seconds at 50% visibility | Avg. watch time, clicks, milestone views (25/50/75%) | |
| X | Per-post analytics | 2 seconds at 50% visibility | Video views, retweets, engagement rate |
Use these dashboards to pull one baseline metric for each goal:
- Reach
- Attention
- Engagement
- Conversion
How to Turn Metrics Into Better Videos and Better Results
Use metrics to decide what to change in the next video. That’s the whole game. Each number should point to a clear edit, test, or CTA update.
Match Goals to the Right Metrics and Track Them in a Simple Dashboard
Not every metric matters for every goal. If the aim is awareness, watch reach and impressions. If you want to build a community, pay attention to comments and saves. If the goal is traffic or sales, track clicks, CTR, and conversions. Pick the wrong metric, and you’ll end up fixing the wrong thing.
A simple dashboard with four columns - Awareness, Engagement, Attention, Conversion - makes this easier. Each column ties to one decision:
- Awareness for reach
- Attention for retention
- Engagement for interaction
- Conversion for action
Check it daily for small wins, weekly for short-term patterns, and monthly for bigger calls like content themes or posting frequency.
How to Diagnose Weak Spots Using Common Metric Patterns
Start with the pattern. Then fix the weakest link.
| Metric Pattern | Likely Problem | What to Fix |
|---|---|---|
| High views, low watch time | Weak hook or slow opening | Rework the first 3–10 seconds; cut the intro |
| High CTR, low retention | Content doesn't match the title/thumbnail | Deliver on the promise you made upfront |
| High retention, low reach | Weak distribution or packaging | Redesign the thumbnail; optimize the title for search or curiosity |
| High engagement, low clicks | Vague or missing CTA | Add a verbal CTA with a clear reason to click |
Run a mute test on the first 5 seconds. If the visuals alone don’t stop the scroll, the opening needs work. Thumbnail A/B tests can also improve CTR in a meaningful way.
How to Use Retention Data to Improve Scripts, Pacing, and Recording Workflow
Retention data shows where attention drops off. That tells you what to rewrite.
A sharp drop in the first 10 seconds usually means the hook is weak or the thumbnail set the wrong expectation. A slow slide in the middle often points to pacing problems or repeated ideas. A flat plateau is a good sign. That section is doing its job, so use it as a model in future scripts.
"Viewers are more likely to stay if they believe they'll see something new. Whenever they feel like the next minute is easy to predict, they may lose interest and move on." - Mario Joos, CEO, Brightrock
When you see a drop-off, start with the script. Add an open loop early, like "In two minutes, I'll show you the exact fix", to give people a reason to keep watching. Add a pattern interrupt about every 30 seconds - a camera cut, a graphic, or a new example - to reset attention. For short-form videos, a loopable ending can drive repeat views and more watch time.
Keep recording settings consistent so retention drops reflect the content, not the production. Evelize helps standardize that workflow. With that consistency in place, it’s much easier to compare one video with the next.
How to Build a Long-Term Video Metrics Strategy
Once you’ve tracked retention, engagement, and conversions, take a step back and look across your whole content library. That’s where long-term growth starts. One video can flop for all kinds of reasons. Patterns across many posts are what matter.
Review Trends by Content Theme, Posting Schedule, and Audience Segment
Sort your videos by content type - tutorials, behind-the-scenes clips, product explainers, and educational breakdowns. Then compare them using average percent viewed, not raw watch time. That gives you a fair way to measure videos of different lengths.
Use that data to spot which themes keep attention, earn saves, or lead to conversions. When you find those patterns, do more of what works. Then layer in audience data like age, location, device, and posting cadence. That helps you find the combinations that keep showing up as winners.
A simple review rhythm helps:
- Check daily for drop-offs
- Check weekly for content-theme patterns
- Check monthly for channel-level shifts
- Check quarterly for bigger strategy changes
That’s how isolated results turn into repeatable content decisions.
Compare Platforms by Patterns, Not Raw Totals
After you know which formats work, look at where they work best. This is where a lot of people get tripped up. Raw totals don’t match across platforms because each app counts a view in its own way.
So don’t chase the biggest number on the screen. Compare the patterns instead.
Look at where completion rates stay strong, where saves and shares are highest, and where conversions happen. Use UTM parameters to track which platform drives traffic and purchases. That’s the data you can act on - where to spend more time, where to post more often, where to pull back, and where repurposed content makes sense.
| What to Compare | Why It Matters |
|---|---|
| Completion rate | Shows where content connects and keeps attention |
| Saves and shares | Signals high-value content and word-of-mouth potential |
| CTR and conversions via UTM | Reveals which platform drives business results |
Conclusion: Focus on Metrics That Lead to Clear Next Actions
At this stage, the goal isn’t more data. It’s better decisions.
Each metric in this guide should lead to a next step. Retention data helps you rewrite hooks and fix pacing. Saves and shares point to your best topics. CTR and conversions connect content to revenue.
The creators who keep getting better tend to do three things well: they track the right metrics, review them on a set schedule, and use what they learn to shape the next video. After each review, aim to leave with one next action per post, not a vague recap of performance.
"Watch time is the currency of YouTube. The longer you keep people watching, the more YouTube will push your content." - Derral Eves, Founder, VidSummit
Across any platform, the job stays the same: give people a reason to keep watching, track whether they do, and use that signal to improve the next piece.
FAQs
Which video metrics matter most for beginners?
For beginners, focus on metrics that show attention and interest. Raw view counts can look nice, but they don't tell you much on their own.
- Average watch time and retention: These show whether your hook is doing its job and where viewers start to drop off.
- Engagement rate: Pay close attention to shares and saves. Those often signal that people found the content useful.
- Click-through rate: This shows whether viewers take action after watching.
How often should I review my video metrics?
Stick to a steady rhythm: daily monitoring, weekly reports, and monthly strategy reviews.
That cadence helps you see what clicks with your audience, where people start to drop off, and how to fine-tune your content plan for better reach and engagement over time.
What should I fix first if retention is low?
First, look at your video's hook. If you see a steep drop right away, the opening probably isn't pulling people in, or it doesn't line up with what the thumbnail promised. Tighten the intro and get to the point faster.
Then check the retention graph for exact drop-off spots. If people leave in the middle, the pacing may be dragging. Mix things up with pattern interrupts, like switching camera angles or adding graphics every 30 seconds.
Related Posts
Ready to Elevate Your Content?
Try Evelize for free and experience the easiest way to create, edit, and share professional videos. Script writing, teleprompter, and powerful video tools - all in one app!
